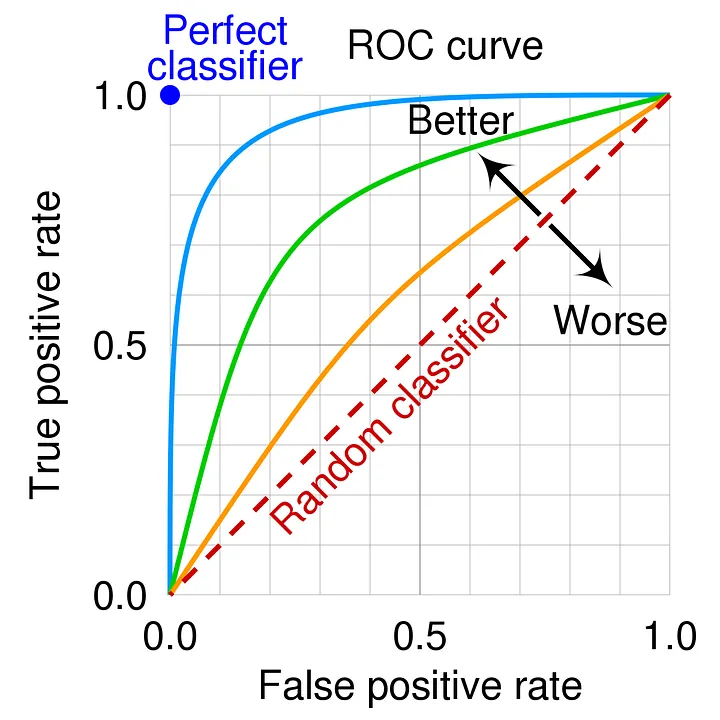
An ROC (Receiver Operating Characteristic) curve is a graphical representation of the performance of a binary classification model at different classification thresholds. It plots the True Positive Rate (TPR) against the False Positive Rate (FPR) as the classification threshold is varied.
Here are the key components and concepts related to an ROC curve:
True Positive Rate (TPR) or Sensitivity:
- TPR = True Positives / (True Positives + False Negatives)
- It represents the proportion of actual positive instances that are correctly classified as positive by the model.
False Positive Rate (FPR) or 1 - Specificity:
- FPR = False Positives / (False Positives + True Negatives)
- It represents the proportion of actual negative instances that are incorrectly classified as positive by the model.
Classification Threshold:
- The threshold is a value used to convert the predicted probabilities or scores into binary class labels.
- Instances with predicted probabilities above the threshold are classified as positive, while those below the threshold are classified as negative.
ROC Curve Plot:
- The ROC curve is created by plotting the TPR on the y-axis and the FPR on the x-axis for different classification thresholds.
- Each point on the curve represents a different threshold value.
- The curve starts at (0, 0) and ends at (1, 1), connecting the points corresponding to different thresholds.
Diagonal Line:
- A diagonal line from (0, 0) to (1, 1) represents the performance of a random classifier.
- A model with an ROC curve close to the diagonal line indicates poor performance, as it suggests that the model's predictions are no better than random guessing.
Area Under the Curve (AUC):
- The AUC is a single scalar value that summarizes the overall performance of the classifier across all possible thresholds.
- It represents the probability that a randomly chosen positive instance will be ranked higher than a randomly chosen negative instance by the classifier.
- An AUC of 1.0 indicates a perfect classifier, while an AUC of 0.5 suggests a random classifier.
Interpreting the ROC curve:
- A model with an ROC curve that is closer to the top-left corner of the plot (higher TPR and lower FPR) indicates better performance.
- The ideal classifier would have an ROC curve that passes through the point (0, 1), representing 100% TPR and 0% FPR.
- The AUC provides a single metric to compare different models. A higher AUC indicates better overall performance across all thresholds.

The ROC curve is useful for evaluating and comparing the performance of binary classification models, especially when the class distribution is imbalanced or when the cost of false positives and false negatives is different. It allows for visualizing the trade-off between sensitivity and specificity and helps in selecting an appropriate classification threshold based on the specific requirements of the problem.